Model report · YOLO11
EleFind YOLO11
The first EleFind aerial elephant detector combines a single-class YOLO11 model with tiled inference for high-resolution drone imagery. This report preserves the complete published 50-image evaluation and places it beside the newer, larger comparison study.
These headline values come from the original model's 50-image test set. They are self-reported research results, not a guarantee of field performance. The model-to-model comparison below uses a separate held-out evaluation with a retrained YOLO11s fixed-box baseline.
Evaluation context
How this model was measured
The original evaluation set used for the published precision, recall, F1, and mAP values.
Detected elephants, false detections, and missed elephants at the reported operating point.
Fine-tuned for elephants in overhead aerial and drone photographs.
Early stopping used a patience of 20 epochs, with automatic mixed precision enabled.
Operating configuration
- Input and slice size
- 1024 × 1024 px
- Slice overlap
- 0.30
- Confidence threshold
- 0.30
- Cross-tile NMS IoU
- 0.40
- Training batch size
- 16
- Initial learning rate
- 0.01
- Augmentation
- Mosaic · erase · flip
- Intended view
- Overhead / nadir
Evaluation figures
What the model learned
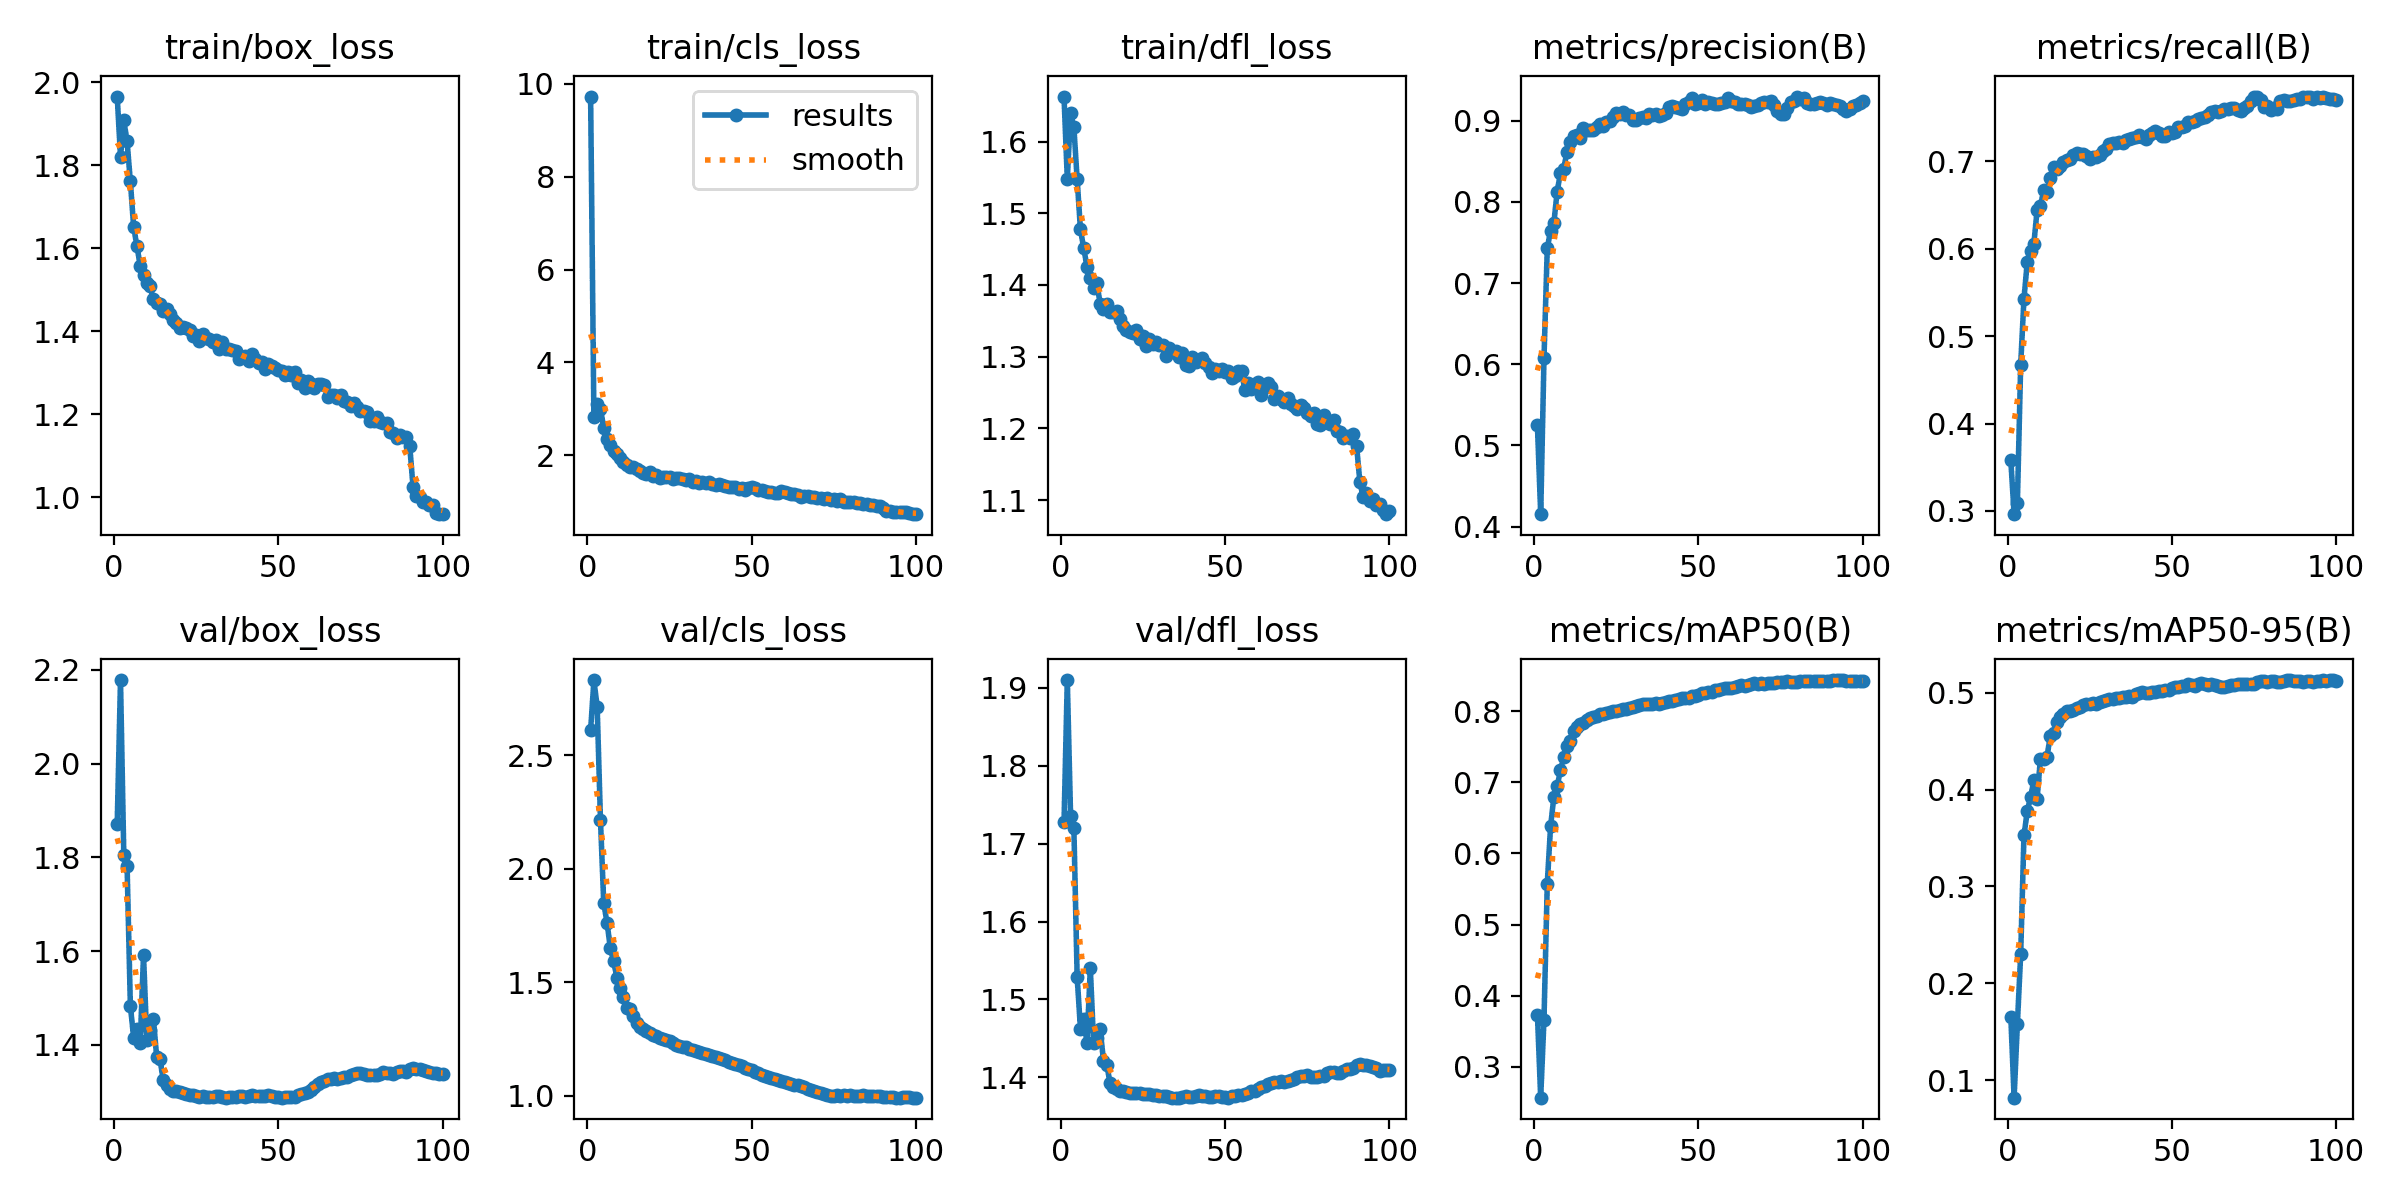
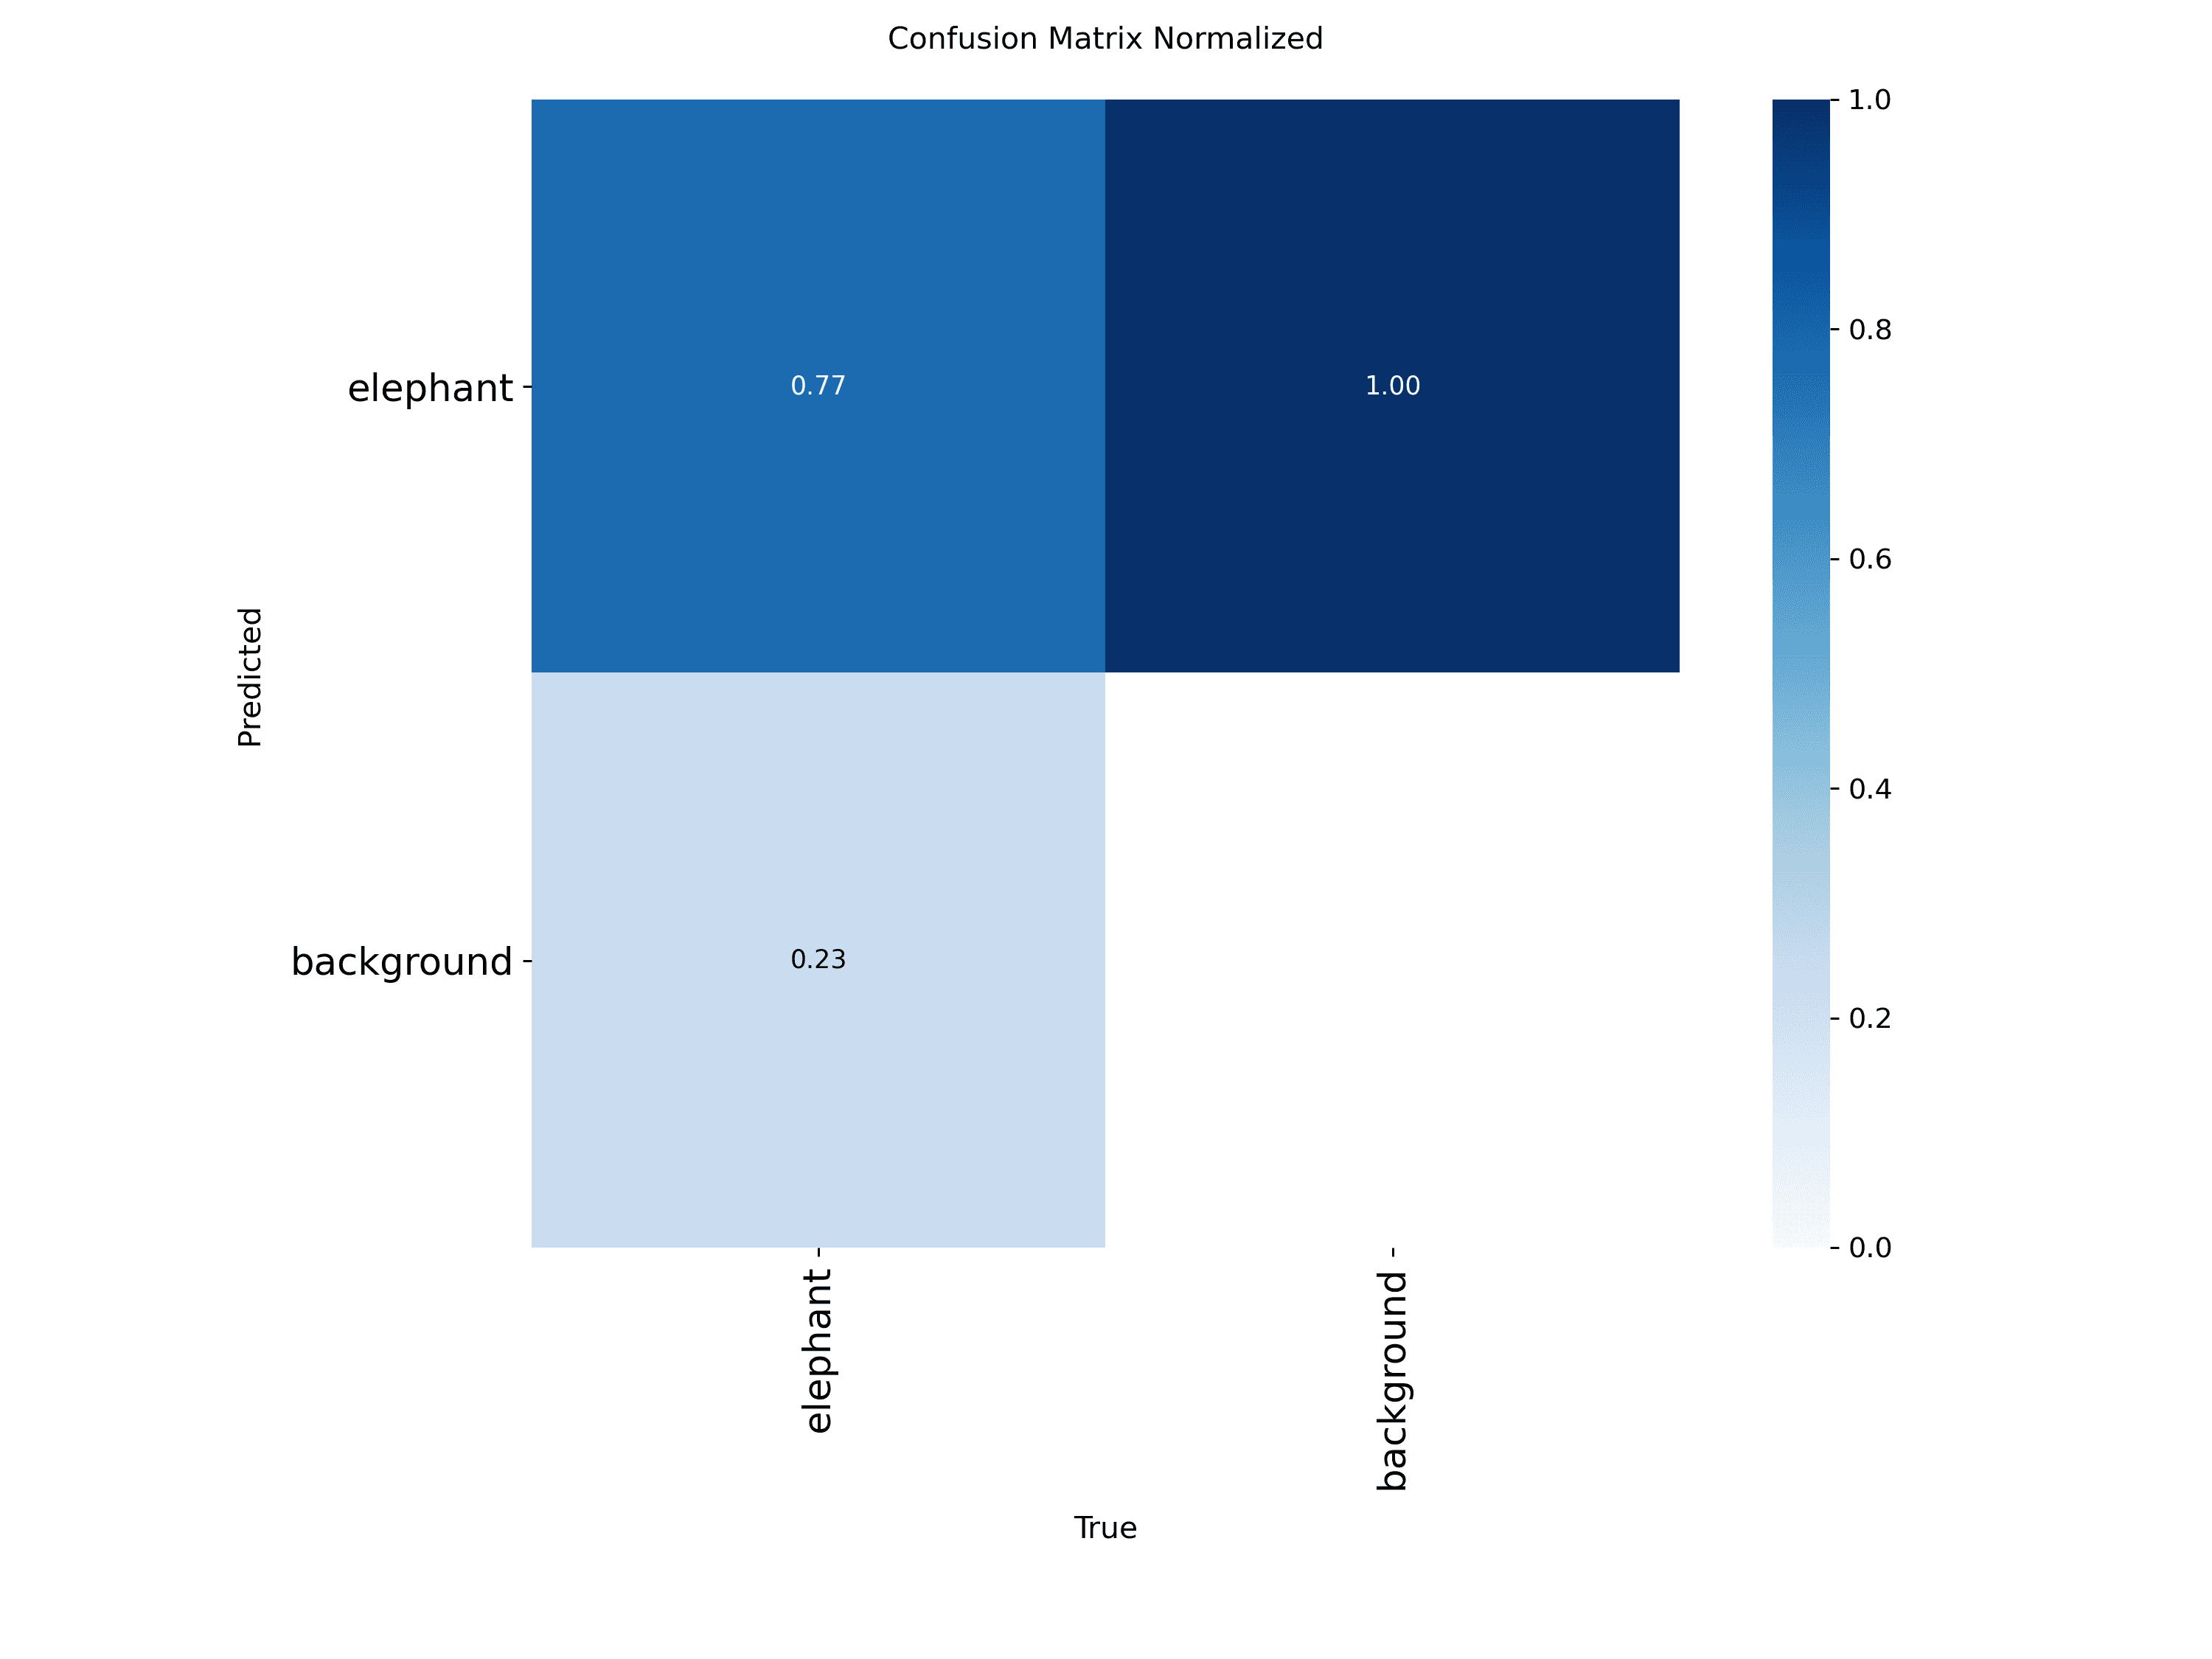
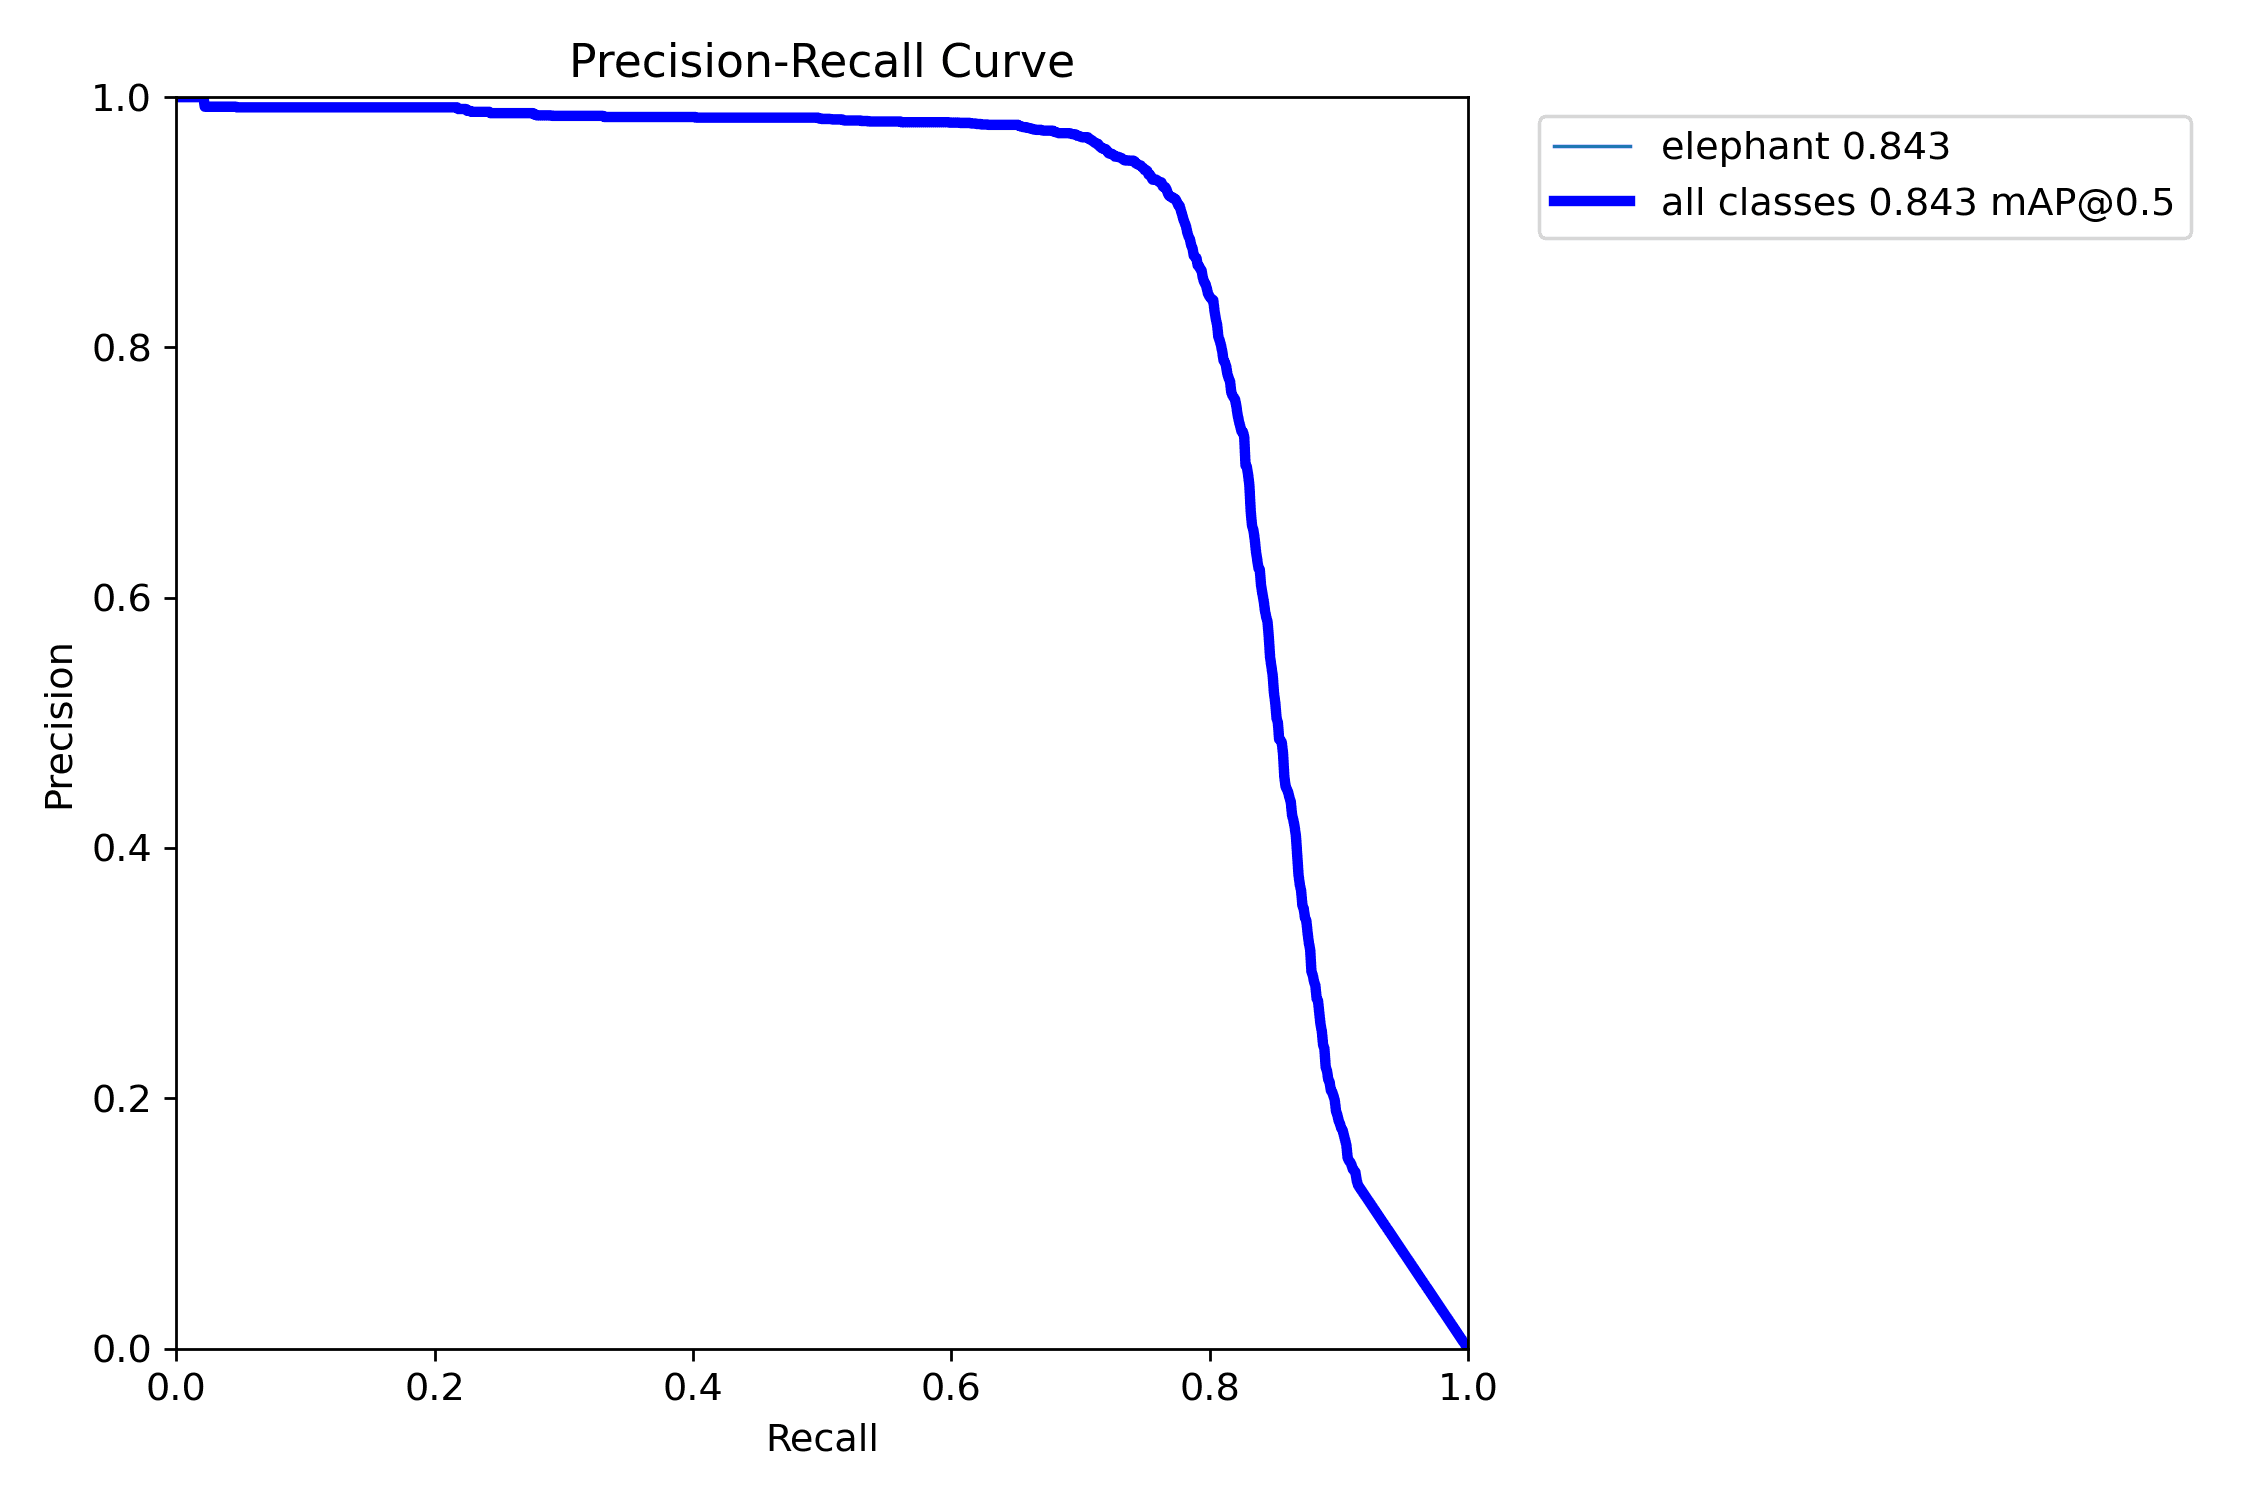
Model comparison
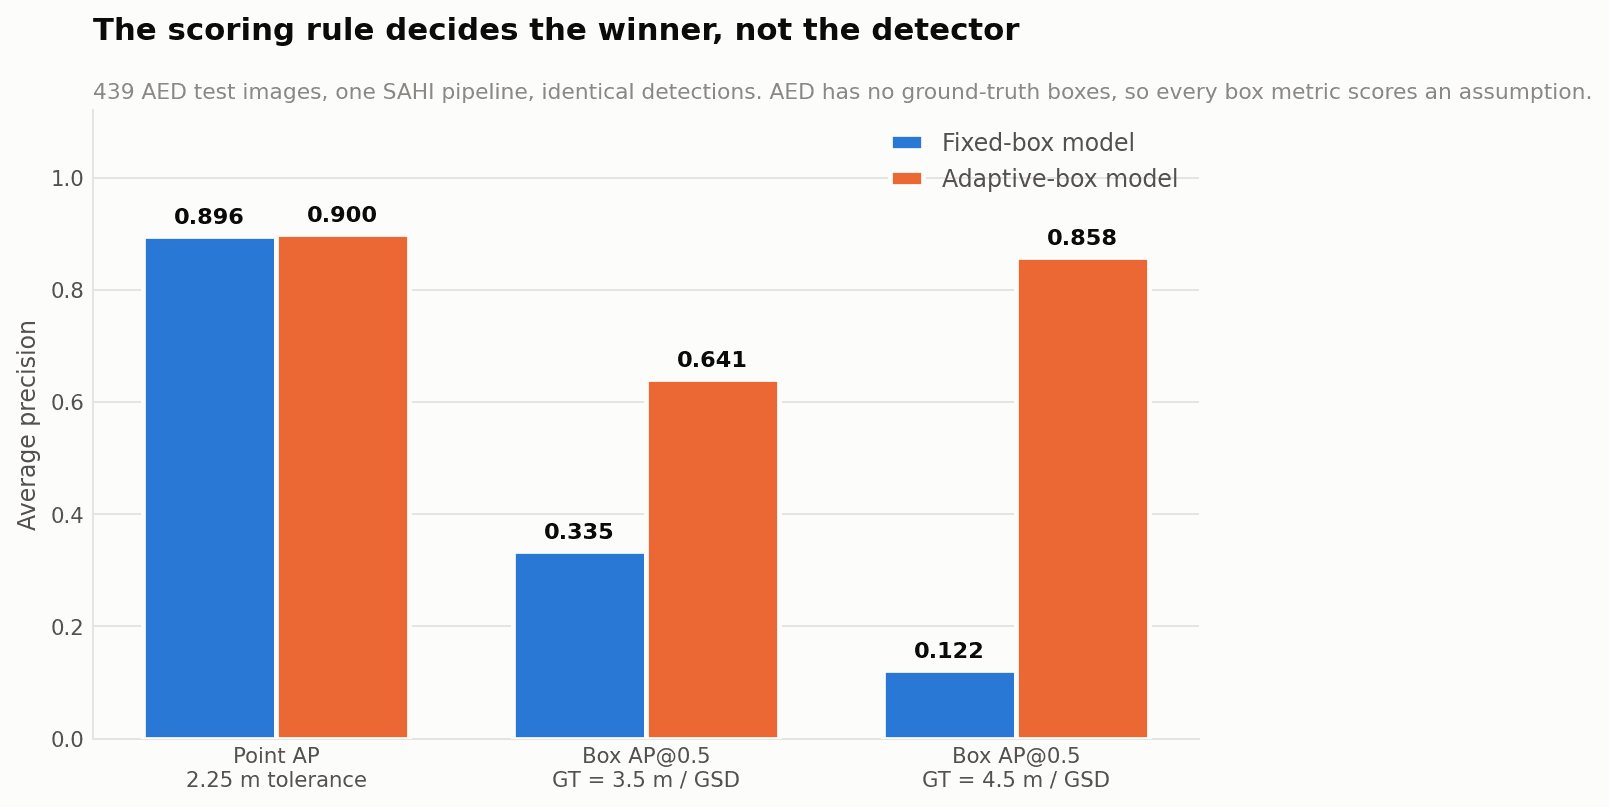
YOLO11s baseline vs YOLO26s
For an apples-to-apples generation comparison, YOLO26s was evaluated beside a separately trained YOLO11s fixed-box baseline on the same held-out Aerial Elephant Dataset photos. That comparison is distinct from the 50-image YOLO11 report above.
Known limits
- The original headline metrics use only 50 test images.
- Dense vegetation and heavy occlusion can hide small elephants.
- Rocks, shadows, and similarly sized objects can create false positives.
- Side-angle imagery is outside the overhead-view training objective.